


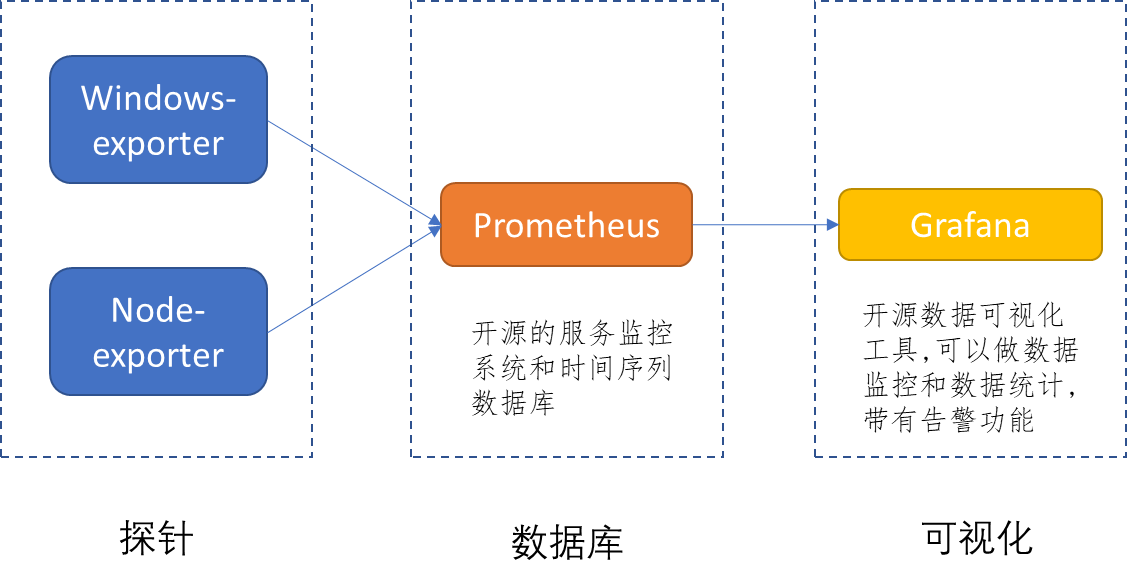
Grafana 本身不采集数据,只做可视化展示;获取服务器数据需要一套完整链路: 服务器采集器 → 时序数据库 → Grafana 读取库数据绘图
主流两套方案:
- Prometheus + Node Exporter(最通用,Linux/Windows 服务器)
- InfluxDB + Telegraf(适合服务器、硬件、日志混合监控)
一、主流方案 1:Prometheus + Node Exporter(推荐)
1. 组件分工
- Node Exporter:部署在被监控服务器,采集 CPU、内存、磁盘、网络、负载等系统指标,暴露 HTTP 接口
- Prometheus:定时拉取各服务器 Exporter 的指标,存储时序数据
- Grafana:连接 Prometheus 数据源,面板展示服务器监控图表
2. 分步操作
步骤 1:所有待监控服务器安装 Node Exporter
- 下载对应系统二进制包(Linux/Windows)
- 后台启动,默认监听
9100端口
# Linux 简易启动
./node_exporter --web.listen-address=:9100
- 验证:访问
http://服务器IP:9100/metrics,能看到大量硬件指标即采集正常
步骤 2:Prometheus 配置抓取目标
编辑 prometheus.yml,添加监控目标:
scrape_configs:
  - job_name: "linux_server"
    static_configs:
      - targets:
          - "192.168.1.10:9100"  # 服务器1
          - "192.168.1.11:9100"  # 服务器2
重启 Prometheus,访问 Prometheus UI → Targets,状态 UP 代表成功拉取服务器数据。
步骤 3:Grafana 添加 Prometheus 数据源
- Grafana 左侧菜单 → Connections → Data sources → Add data source
- 选择 Prometheus,填写 Prometheus 地址
http://prometheusIP:9090,保存测试连通性 - 导入服务器通用面板:
- Grafana 官方面板 ID:1860(Node Exporter 全功能服务器监控)
- 导入后自动展示 CPU、内存、磁盘 IO、网卡、系统负载、温度等全部服务器数据
Windows 服务器补充
Windows 使用 windows_exporter,端口 9182,Prometheus 配置 targets 填写 ip:9182,配套面板 ID 10467。
二、方案 2:Telegraf + InfluxDB(适合多类型数据)
链路
Telegraf(服务器采集)→ InfluxDB(存储)→ Grafana 读取 InfluxDB
- 服务器安装 Telegraf,开启
inputs.system、inputs.cpu、inputs.mem插件采集系统数据 - Telegraf 配置输出到 InfluxDB
- Grafana 添加 InfluxDB 数据源,写 InfluxQL 查询服务器指标绘图
三、其他采集方式(特殊场景)
1. Agent 推送模式(不开放服务器端口)
- Prometheus Agent:服务器部署 Agent,主动推送指标到远端 Prometheus,无需暴露 9100 外网端口
- Grafana Agent:一体化采集,直接推送数据到 Grafana Cloud / Loki / Prometheus
2. 监控 Docker/K8s 服务器节点
- node-exporter 容器化部署,采集宿主机硬件资源
- cadvisor 采集容器资源占用,搭配展示服务器 + 容器双层监控
3. 直接监控 Windows 性能计数器
windows_exporter 读取 Windows 性能计数器,无需额外脚本。
四、Grafana 查询服务器数据核心示例(PromQL)
导入面板可直接用,手动自定义面板参考:
# CPU使用率
100 - (avg by (instance) (irate(node_cpu_seconds_total{mode="idle"}[1m])) * 100)

# 内存使用率
100 - (100 * node_memory_MemFree_bytes / node_memory_MemTotal_bytes)

# 磁盘使用率
100 - (100 * node_filesystem_free_bytes / node_filesystem_size_bytes)
五、常见问题排查
- Grafana 无数据
- 检查 Exporter 是否正常运行、端口通不通
- Prometheus Targets 是否 UP,有无抓取报错
- Grafana 数据源地址、账号权限是否正确
- 指标缺失
- node-exporter 未挂载磁盘、网卡权限不足
- 防火墙拦截 9100 端口,Prometheus 无法拉取 metrics
极简总结获取流程
- 被监控服务器装采集器 (node_exporter),采集硬件数据
- 时序库 (Prometheus) 定时拉取并存储数据
- Grafana 绑定时序库数据源,导入服务器模板面板读取并展示所有监控数据